Understand the features and basic settings of the Smart View
How do I get there?
Select Smart View from the side menu to be redirected to today's Smart View.
When hovering on Smart View you also open a sub-menu.
From here you can access the Smart Views for the upcoming 12 months, but also create a new Smart View to add to your existing ones.

What are the different features of the Smart View?
1. The Feeds
Selecting the View:
On the top right of the Smart View you can choose between two options:
- Show all feeds
- Show only favorites
Select either:
- Symbol ✓ = show all current feeds
- Symbol ★ = bring up only your saved items
.png)
There's more:
Weather forecasts, Events, holidays and vacations, and saved Smart Views are displayed on top of the page. Find out how to make the most of these feeds.
.png)
2. The Smart View graph
One of the most loved features of HQ revenue Market Intelligence, the Smart View graph displays your and your competitors' rates in a clear and intuitive way.
Find out more about the Smart View Graph and how it works.
3. Navigation
You can use the arrows to change the date range by week, month or year.
You can also go back to see past data! The middle circle brings you back to today.
.png)
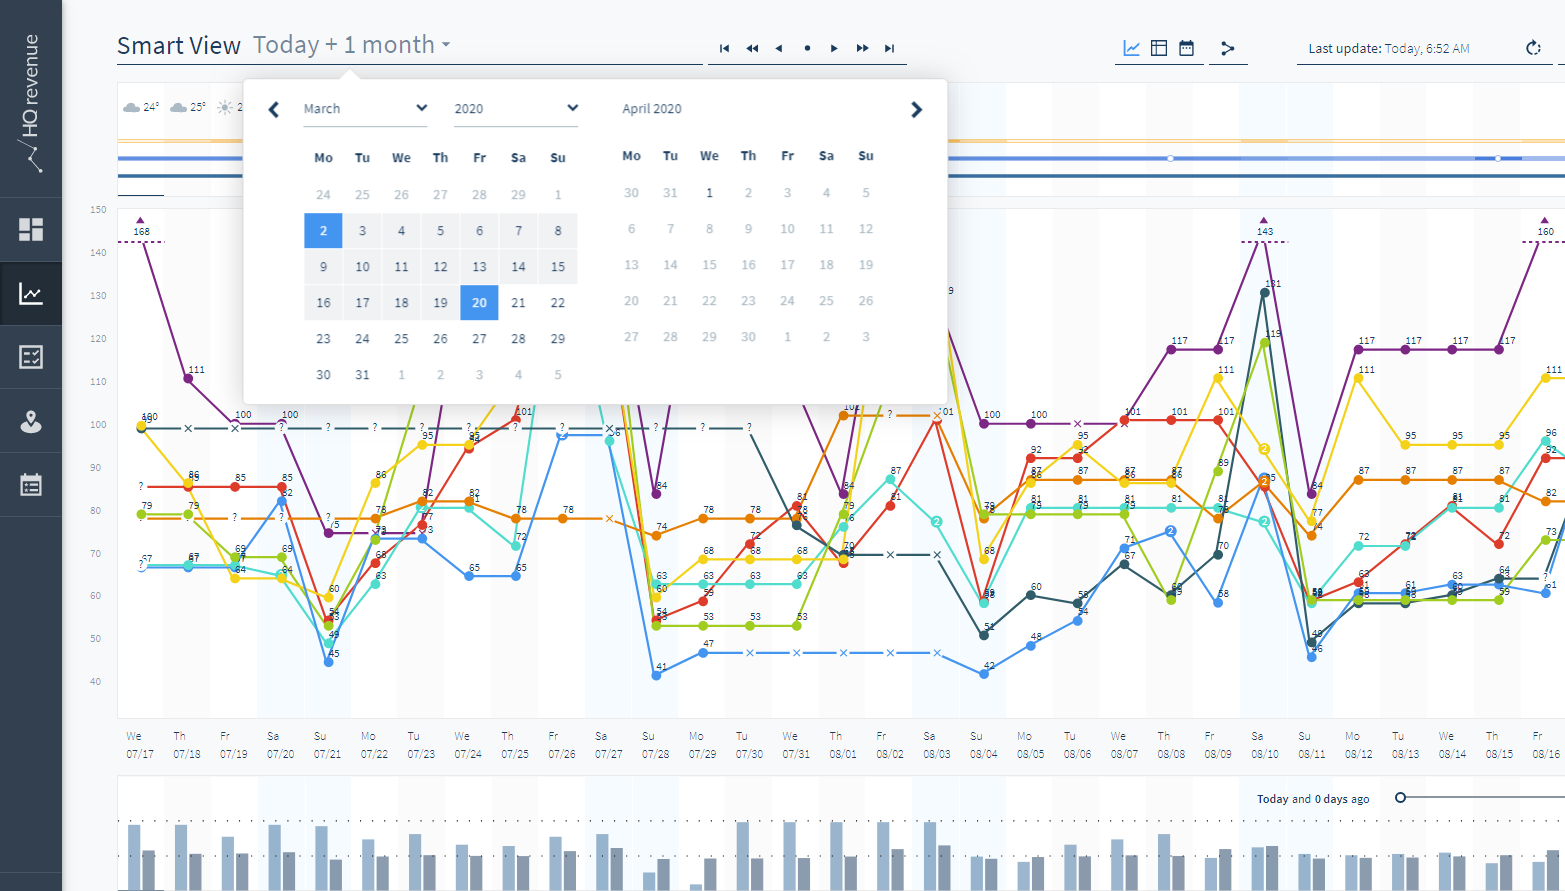
4. Smart View Date Picker
Click on the date or arrow to open the drop-down that lets you choose a date range.
When you select the end date we immediately pull the data for the dates selected and adjust the view. This will be applied to the graph, table, and calendar perspectives.
5. Filters
Click on the funnel in the top right corner to start using the filter.
Tailor the graph to your needs by selecting only the information relevant to you.
6. City Demand and occupancy rate
At the bottom of the Smart View you'll see a row of bar graphs that display:
- the occupancy rate for your hotel (left bar)
- the city demand in your location (right bar)
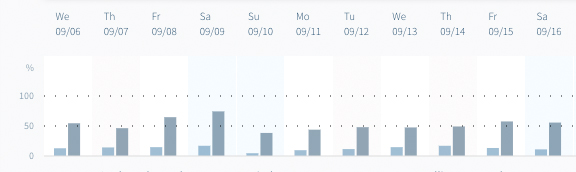
This data is synchronized with your PMS and allows you to make an accurate comparison between the two data sets. (If your occupancy information is not yet integrated, please contact our support team.)
Discover how to use and navigate the City Demand and Occupancy graph in detail.
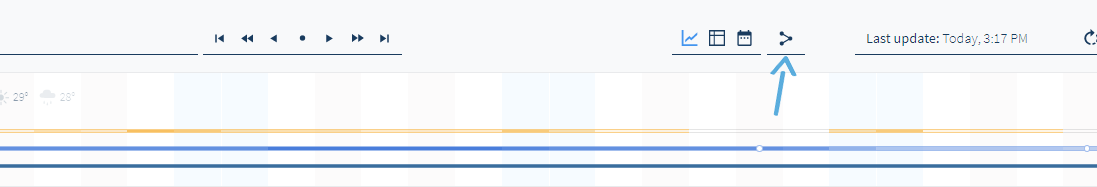
7. The export button
You can export and save a Smart View as an Excel file.
Click on the arrow on top of the page > OK.

I’m not a big fan of graphs, can I see the data in another way?
If charts and graphs don't do it for you, worry not!
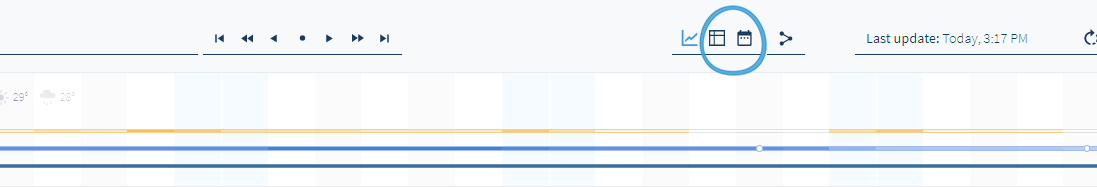
You can decide to view your information in a table or calendar layout.
To do so, click on the icons as circled in the image below:
Overwhelmed by the result?
The table view can make navigation easy-peasy.
Or check the data from the calendar view.
Whenever you wish to return to the graph view, click on the graph symbol again:
.png)
Do you have any questions or need help?
Contact our support team, and we will be happy to help you.