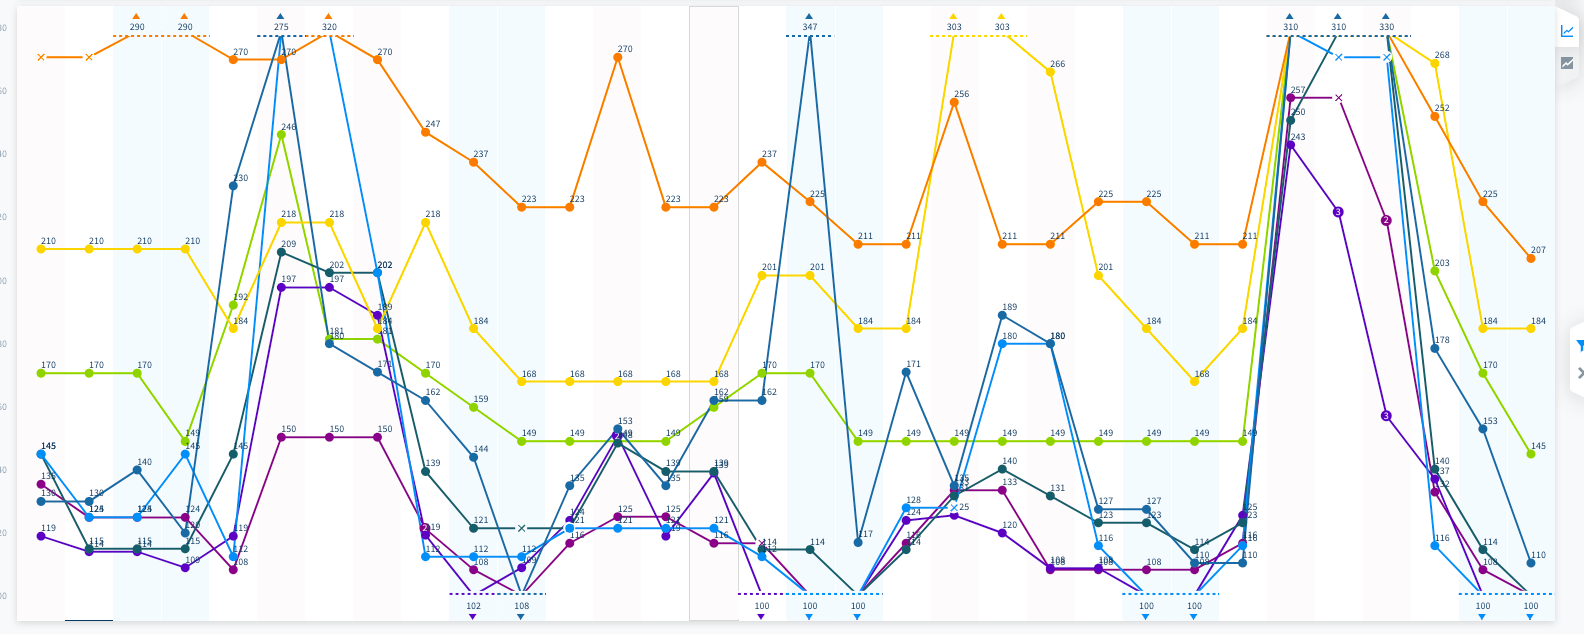
An intuitive layout of the rate evolution - make an accurate analysis and comparison of your competitor's yielding strategies
The Smart View graph shows a clear snapshot of your competitors' rates compared with your own.
Table of contents:
2. Advanced & Simple Graph Views
5. Single-Click Smart View (aka Daily rate comparability)
Hotel Selection
Want to see only specific competitor rates in the graph?
With the Smart View graph open, click Strg (Mac: cmd) on any hotel name at the bottom of the page and the graph will display rates for just this hotel.
This can speed up the work and helps you track each competitor's rate development with clarity.
The Advanced & Simple Graph View
In just one click you can get a clear view of where your hotel stands compared to:
-
the median value or
-
the average price of your competitors
Advanced View
Simple View
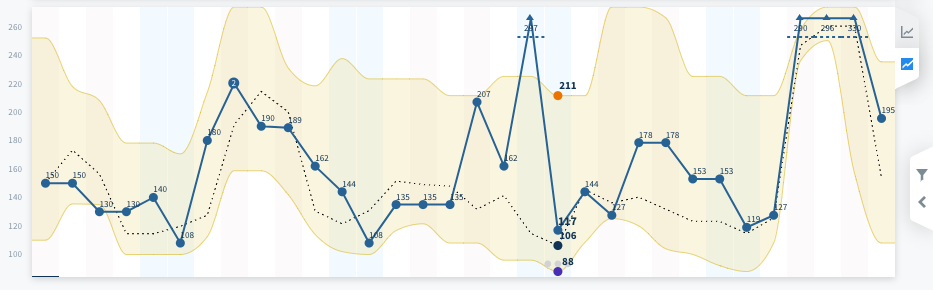
Here the price tunnel of your Comp Set (above) is a clear, orange graph together with:
- the line graphs of your rates and
- the median value or average price
This way, you can see at a glance if you are above or below the median value.
Tip: You can influence the price tunnel and the median value to adjust them to your analysis by selecting or deselecting the hotels included.
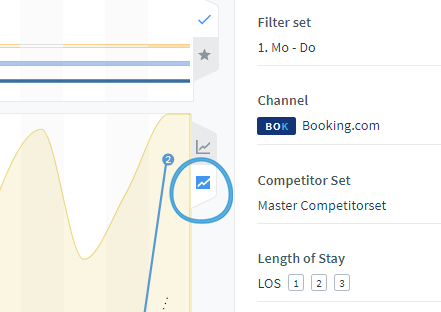
Need to switch between advanced and simple views?
Click the tabs with the graph symbols on the right-hand side of the Smart View (below):
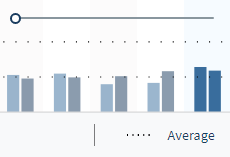
Need to switch between median and average price?
Click on the respective word in the legend. The comparison value also changes in the day pop-over.
Using the Smart View Filter
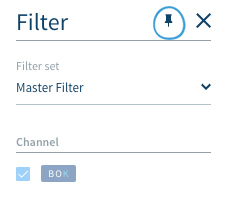
Pin your Filter!
Click on the funnel on the top-right corner of the page to open the Smart View graph filter settings. When the menu opens, you can decide to pin it:
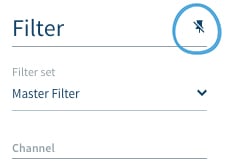
To unpin the filter, click on the unpin symbol on the top-right corner:
Choose your Filter
Choose the filter you want to apply from the first drop-down list.
This will display your Master Filter and the additional filter sets that you have previously created.
Click on a specific filter set to apply the settings to the Smart View graph.
You can modify the filter settings at any time by changing the parameters:
-
Channel
-
Competitor Set
-
Length of Stay
-
Room category
-
Room occupancy
- Type of rates (BAR, APR, Semi-Flexible Rates)
-
Type of meal plans
Changes save automatically as soon as you adjust something in the filter.
Note: This will not save among your Filter sets but only apply to the current Smart View.
The Advanced Meal Planner Filter
You can also compare your competitor rates including or excluding their different meal plans. To enable this feature, set the meal plan rates for:
- Your own hotel: Settings > My Hotel
- Your competitors: Settings > Competitor settings
If they are available online, they get automatically uploaded but they can also be overwritten manually anytime. To apply it simply switch the toggle Advanced next to Meal Plan in the filter.
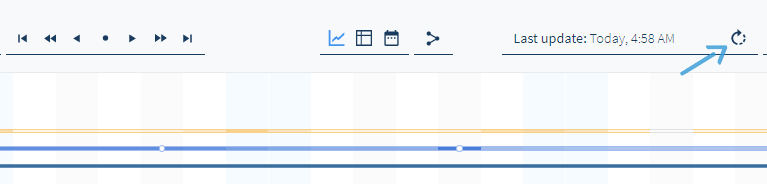
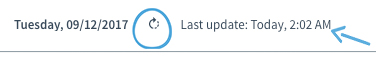
Refreshing Rates Data
To refresh data in the whole graph, click the refresh arrow on top of the page next to Last Update.
Note: The graph refresh might take a few moments to update.
The app digs deep and far for the freshest, fittest data; thou shalt not regret the few seconds' wait.
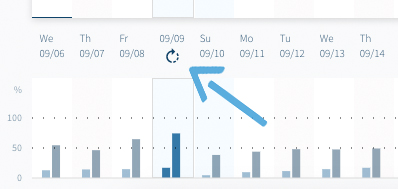
To refresh data for a single day, hover over the date under the graph and click on the refresh icon:
Single-Click Smart View
Daily rate comparability
Click on any point in the graph to open an in-depth overview of room rates for that specific day.
A pop-up will open and show you all the rates for:
-
the selected room types
-
the channels where the rates are available
-
the room type name
-
the price rating
- the type of rate (if you have Semi-Flexible Rates enabled)
Useful information to keep in mind
-
Room rates are ranked from highest to lowest
-
Any dynamic LOS will appear between the rate and the hotel name
-
The room types are listed in the 4th column; if you can't read the full name, hover over it with your mouse
-
The same principle applies to the channel name; although you might recognize these through their color and abbreviation (last column), hover over them if unsure
-
Feel like freshening up your data? Hit the refresh button next to the selected date on top of the box to update it. The time and date of your last update are always visible next to it.
Price Development
Double-click on any day on the graph to access the price development for that day:
Gain detailed information about your competitors' pricing strategies and your own positioning.
Color-Coded Hotel Competitors
Every competitor hotel is color-coded throughout the entire app.
Each color assignment and explanation appears at the bottom next to the corresponding hotel.
Tip: Learn how to change your competitors' colors and settings.
Do you have any questions or need help?
Contact our support team, and we will be happy to help you.