Learn to display useful information from the table perspective
See all relevant Smart View competitor information in a table instead of a graph.
- The table view allows you to make a clear price analysis and comparison between data sets
- All the data is clearly visible, including demand and occupancy
- Changes in room prices are color-marked to highlight changes to the current date
How to access and switch to the Table View?
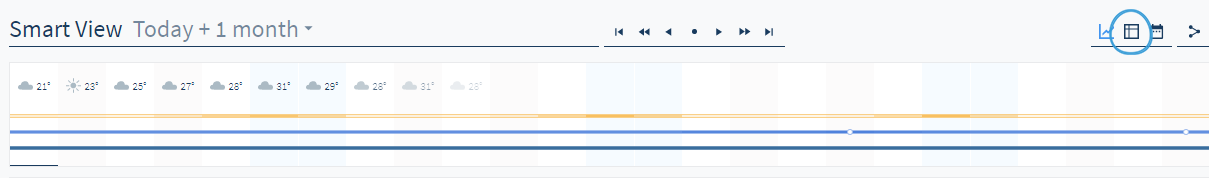
- Open the Smart View (if you don't already)
- Click on the table icon (shown below)
How does the Table View display data?
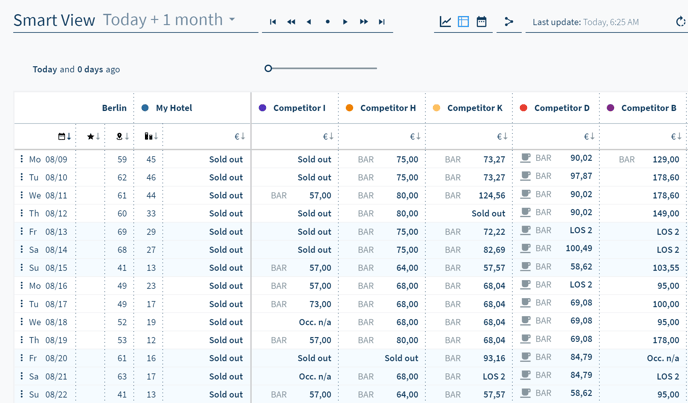
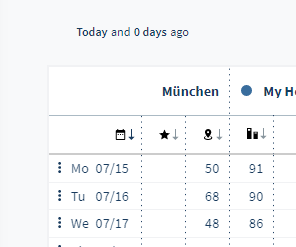
The Smart View Table shows the following:
- Dates of Arrival
- Destination (including Favorites and City Demand)
- Your Hotel and competitors
- Pricing
- Rate types, restrictions, meal plans (if applicable)
One or more columns are grouped under each of these categories depending on whether you are viewing data for a single day or are including snapshot data.
If you are viewing data for a single day:
The city demand is displayed under your destination; your own occupancy and room price are listed under Own hotel; while under each competitor you will see their room price.
Competitors’ room prices are marked in red if they are cheaper than your rates and green if more expensive.
If you have added snapshot data:
There will be additional columns marking any change in demand, own occupancy, own room prices, or competitors’ room prices. Positive changes are marked in green and negative ones in red.
Note: the green/red marking has changed to indicate changes to the current date rather than differences between competitors.
Meal plans in the table view are displayed with an icon next to the room price:

Breakfast

Half board

Full board

All inclusive
How do I add snapshot data?
Analyze data day-by-day relative to the current date.
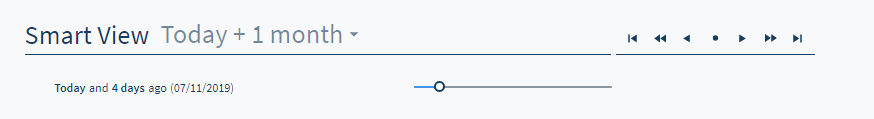
Want to compare data from one of the past 31 days?
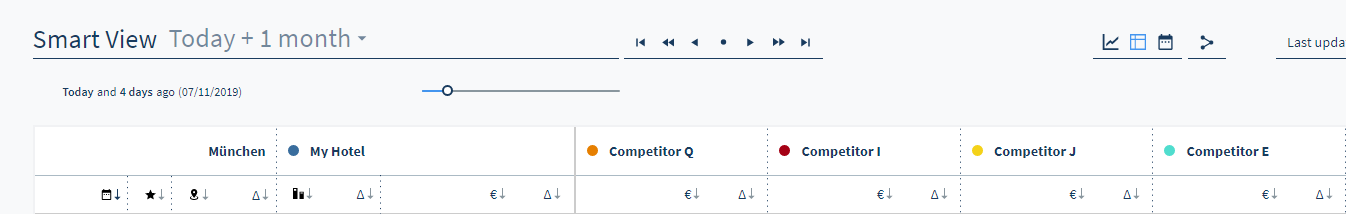
Activate the slider on the top of the page and select the day of interest:
Sorting data in the Table View
You can sort data in the table by any of the column values: Date, Favorites, Demand, Change in Demand, Occupancy, Change in Occupancy, Room Price, Change in Room Price.
To do so, click on the arrow next to the value you wish to sort by:
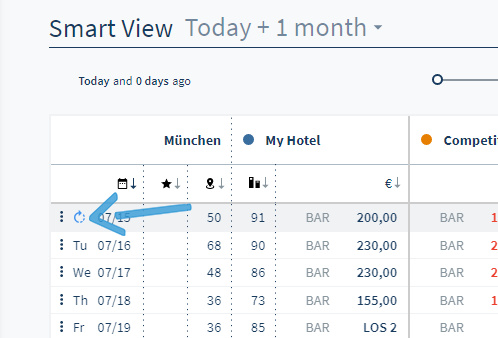
Refreshing data
To refresh the data in the whole Smart View, click on the refresh button on top of the page.
To refresh data for a single day, hover on the date to reveal the refresh button on the left side and click it.
Price Development
To access the Price Development graph double click on any row to see the graph for that day. Alternatively hover over the date and click on the three dots that will appear on the left of the table.
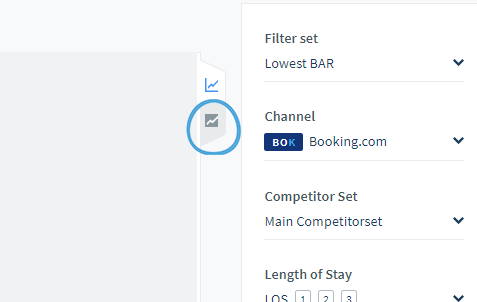
Using the filter
For the user’s convenience, the filter won’t change when switching between graph and table views.
Any doubts about filters?
Median
To quickly see the difference between your room rate and your competitor set’s median, there is also the option of switching to the median view via the tabs on the right side of the page:
Do you have any questions or need help?
Contact our support team, and we will be happy to help you.