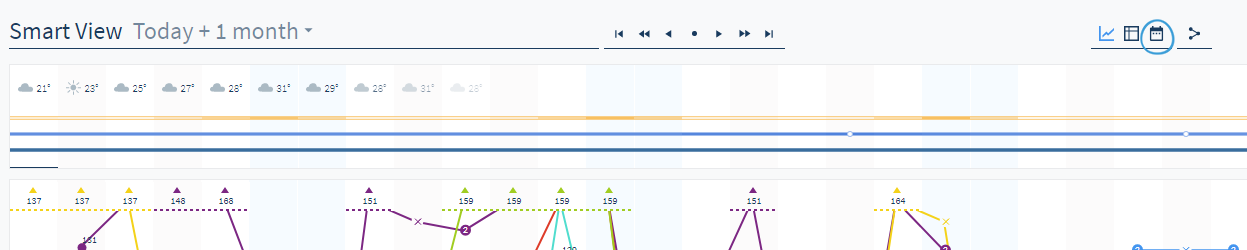
Display the right information from the instant calendar overview
The Calendar View provides an easy-to-read, instant overview of any deviations.
It's a real treat, especially for General Managers and Revenue Managers, to see if and how much room rates are deviating from the initial strategy.
How do I access it?
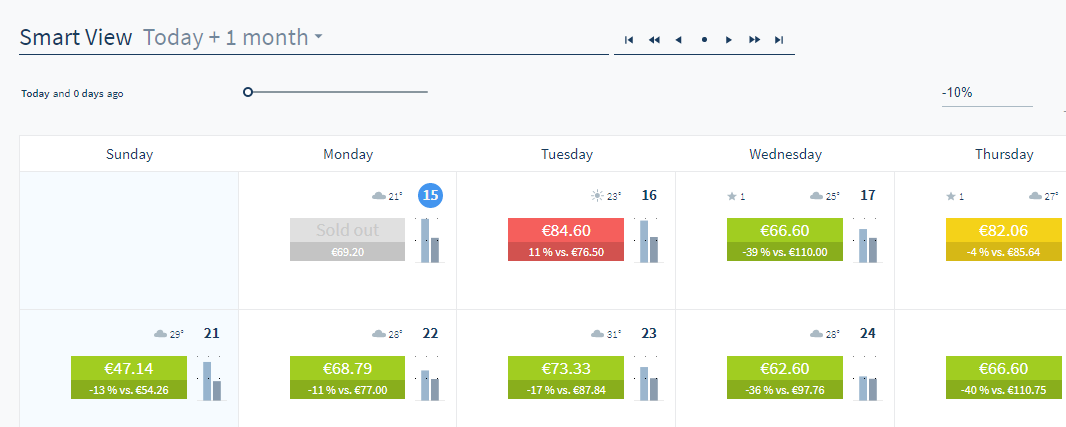
Access the calendar view by clicking on the calendar icon on top of the Smart View.
How does the Calendar View display data?
The same data displayed in the other views is depicted here with clear elements.
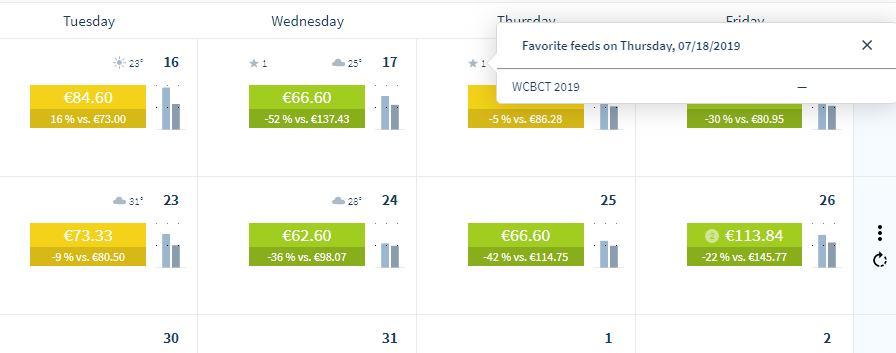
The weather forecast is represented by an icon on the top right of each calendar box:
Click on the star in the top left corner of a calendar box to view events for that day:
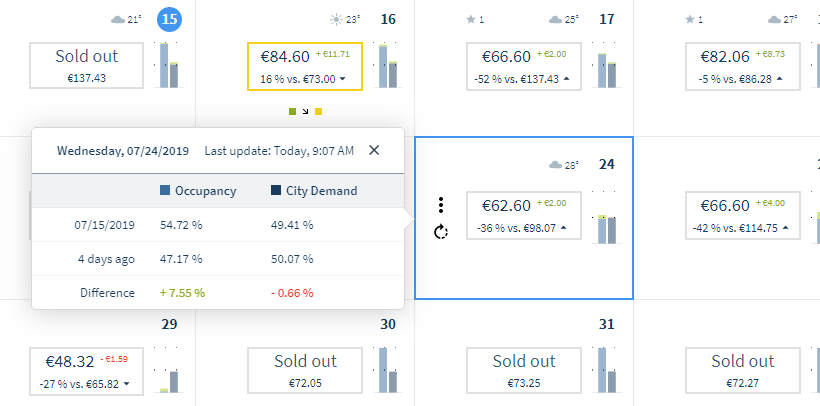
Click on the bar graph on the right side of the calendar box to view the occupancy and city demand:
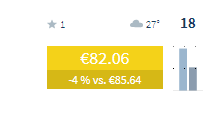
Every colored box highlights your rates and the percentage deviation to the median of your competitors’ rates day by day:
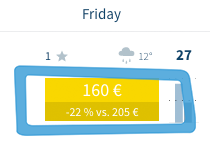
Colors are coded according to the threshold settings. The thresholds are adjustable with the slider on the top right of the page. Any changes will immediately affect the colored boxes:
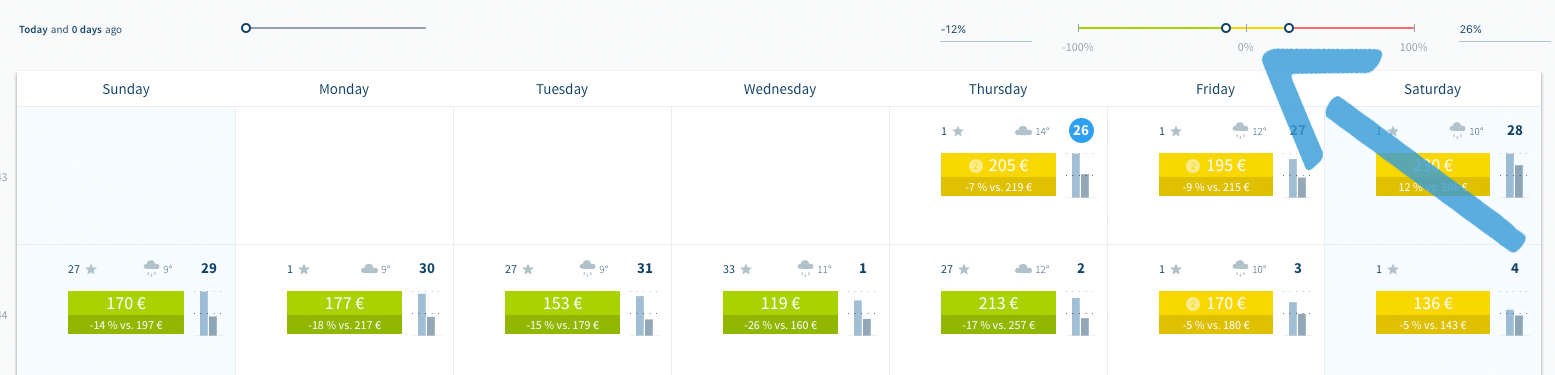
You can also add snapshot data by moving the slider on the top left of the page.
This will add colored borders to indicate the threshold jumps:
Do you have any questions or need help?
Contact our support team, and we will be happy to help you.