A glossary and explanation of the on-screen sections and KPIs
Skip ahead to any section for more information:
- Date for Weekday select
- Internet Booking Engine (IBE)
- Forecast of room nights
- On The Books
- Last Year compares revenue data
- Target Revenue
- Market Data
1. Date
You can inspect the current year to date and today plus 365 days in advance.
Expand the view to see daily numbers per month or collapse it for a monthly overview.
Tip: Create custom date ranges and filter days strategically to segment your data.
2. Internet Booking Engine
This indicates direct demand and is available as an Add-on called "Website Demand".
Enable it by upgrading for free. Simply get in touch with our Support team from inside the app.
3. Forecast
The forecast section shows the number of predicted extra room nights.
Adaptive machine learning algorithms calculate this potential by continuously analyzing your historical numbers and booking behavior.
And the more they assess your data, the better the predictions become.
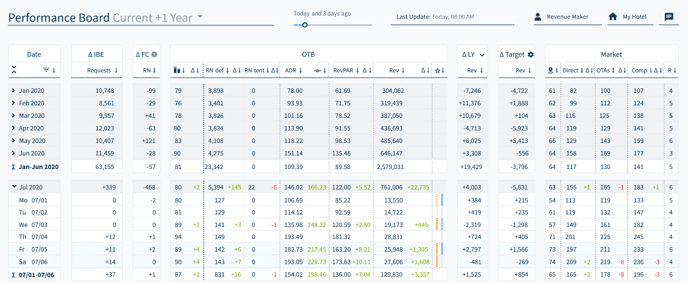
4. On The Books
The holy grail or the place that collects your relevant PMS data.
For the following screenshot, we are comparing numbers from today vs. 4 days ago.
Any pick-up will be shown in green.
-1.png)
Columns
-
Occupancy (%)
-
RN def (definite rooms)
-
RN tent (tentative rooms)
-
ADR (Average Daily Rate)
-
RevPAR (Revenue per Available Room)
-
Revenue (total)
-
Star (hover over yellow or blue symbols to see upcoming events and holidays)
Tip: Click the upside-down arrow to filter numbers from highest to lowest.
Number Rows
-
Row 1: total numbers for year-to-previous-month (61.28% occupancy avg.)
-
Row 2: total numbers for current month-to-date (57.09% occupancy avg.)
-
Row 3+4: total daily numbers for upcoming days (including pick-up)
For more on OTB numbers, see how you can work with and apply historical data.
5. Last Year
See your revenue this year vs. last year, depending on the analysis you want to make.
Select the arrow symbol for a pop-up.
Here, you can make a comparison between the "same date" or "same weekday" last year.
-1.png)
6. Target
This column displays your revenue On The Books:
-
This year vs. your revenue target
-1.png)
When you are ready, you can set your individual revenue targets.
And find out more about how targets are calculated.
7. Market data
The numbers displayed are in real-time and show you:
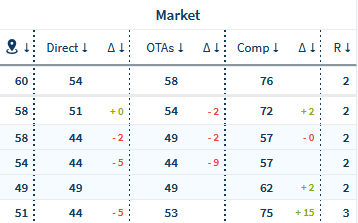
- The City Demand (in %)
- Your Brand.com rate
- Your rate on the primary OTA channel
- The median rate of your comp set
- Your price rank to the comp set
Tip: The market column can help you measure your performance vs. the competition.
Do you have any questions or need help?
Contact our support team, and we will be happy to help you.