How to interpret the numbers and data
This article explores the market data in Performance Board.Introduction
Data is loading
When you first open Performance Board, a circle shows that it is loading the data.
Shopping the rates in real-time - the current year and the next 365 days - may take a short time to complete.
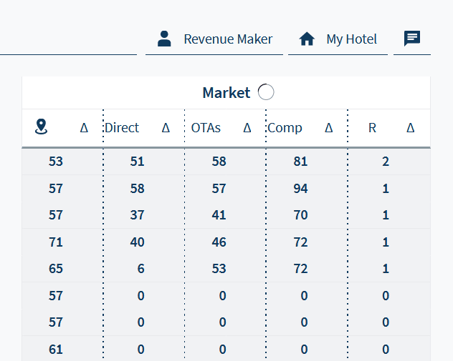
Market Column Overview
Let's say you are ready to put your OTB numbers in context with market data, but wonder how to interpret the numbers?
City Demand
Here a percentage is shown, which you can use as a guide when yielding room rates.
Tip: You can use this percentage as a barometer for spotting anomalous days.
Direct Rate
See your rate on Brand.com for every day. Compare it with the rate on...
OTAs
Your rate on the primary channel. Are you priced higher/lower than the direct rate?
Tip: You can change which channel to consider in Channel Management.
Comp Set
Check how you compare to the median rate of your competitor set.
Tip: You can adjust your comp set in Competitor Management.
R is for Price Rank
Know your price rank within the primary competitor set.
When it shows a 1, it means yours is currently the lowest available rate.
Rate Pop-Up
Click on a day's rate to explore the numbers in more detail.
In this example, for today compared to 4 days ago:
- How close is your rate to the comp set median?
- And to the rest of your competitors?
.png)
The information displayed (from left to right):
- Room rate
- Pick-up (when you apply historical data via the time slider)
- Competitors
- Room type
- Channel
Do you have any questions or need help?
Contact our support team, and we will be happy to help you.